Sourab Saha Top rated

I will automate your Excel reports with VBA macros and UserForms
5.0 on Fiverr and Upwork
From 2 days
From $25
I’m Sourab Saha, a data analyst and automation developer from Kolkata, India, with more than ten years of experience turning manual data work into clean, automated systems. On Fiverr and Upwork I have delivered over 500 data and automation projects for clients in the US, UK, Europe, Australia and the Middle East, with a 5.0 rating on both platforms.
My toolkit is Excel VBA, SQL, Power BI and DAX, Python with Selenium, and Google Apps Script. I collect data from files, databases and websites, clean it, model it and present it so decisions take minutes instead of days. I build and test every tool on your real data, deliver it with a short walkthrough, and keep revising until it works exactly the way you need.
Alongside my freelance work, since 2024 I have also worked as a Data Analyst for AH Group of Industries, a US healthcare group, building automated reports and Power BI dashboards from billing, payroll, audit and attendance data.
Sourab Saha Top rated
5.0 on Fiverr and Upwork
Sourab Saha Top rated
5.0 on Fiverr and Upwork
Sourab Saha Top rated
5.0 on Fiverr and Upwork
Sourab Saha Top rated
5.0 on Fiverr and Upwork
Sourab Saha Top rated
5.0 on Fiverr and Upwork
Sourab Saha Top rated
5.0 on Fiverr and Upwork
Education, language learning
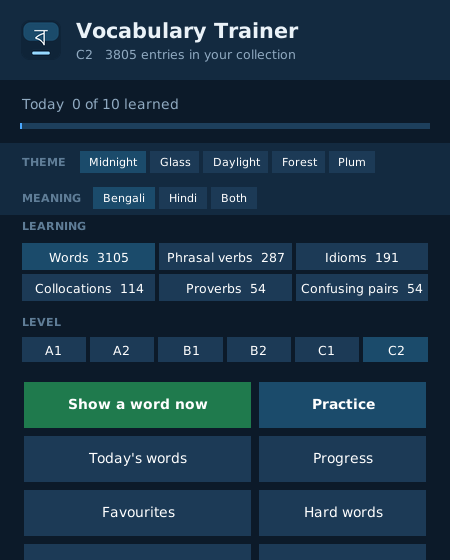
A Windows tray app in Python that teaches English vocabulary starting from Bengali. It shows word cards on a timer, quizzes you in five practice styles…
Own product, productivity
A Windows system tray app written in Python that keeps chosen websites open and fresh in your own Chrome. It refreshes each site on a fixed…
Healthcare Finance
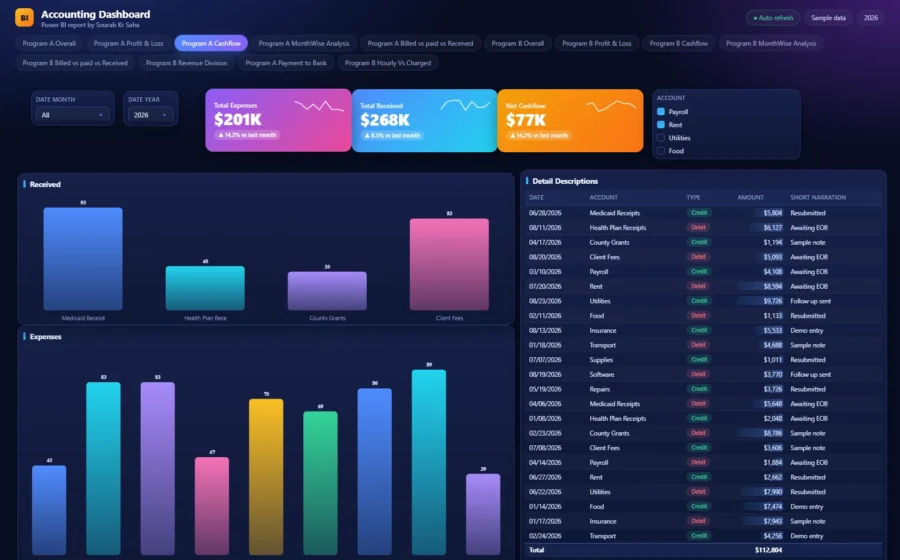
A finance report in Power BI for two healthcare programs: monthly summaries, profit and loss by month, cashflow with received and expense charts, month wise expense…
Behavioral Health (US)
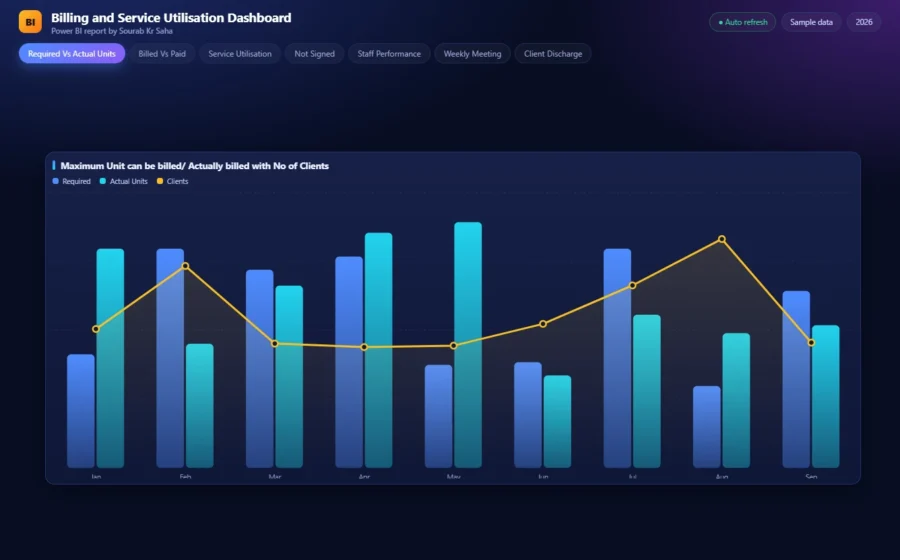
A Power BI report that compares the units each client could be billed with the units actually billed, tracks billed versus paid by month and follows…
Behavioral Health (US)
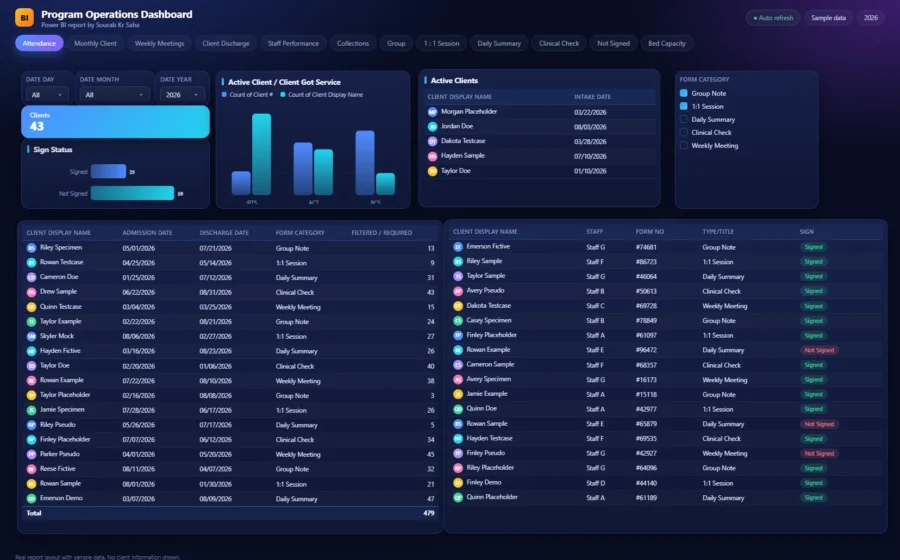
A 12 page Power BI report for a behavioral health provider that tracks attendance, clinical charting, signatures, weekly case reviews, discharges, staff performance, collections and bed…
Corporate Finance and Accounting
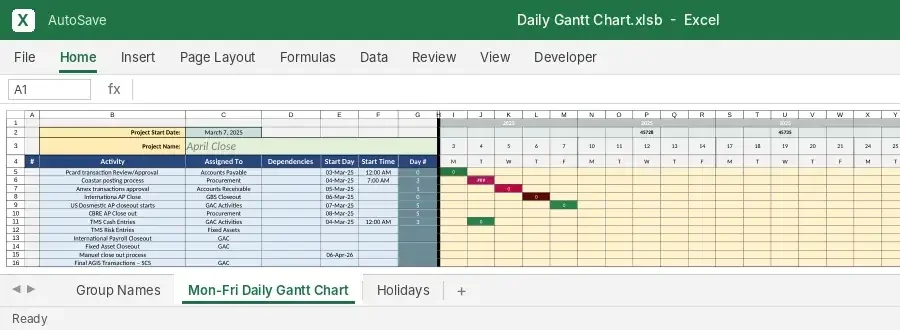
A daily Gantt chart for a finance team's month-end close. Activities, owners, dependencies, start day and duration drive a weekday-only timeline, public holidays are flagged automatically…